Why Pivot Table in Excel??
Let’s face it—Excel can be daunting.
You open a file, and there it is: hundreds (sometimes thousands) of rows of numbers looking back at you. You might feel lost.
But if you work with any kind of data—sales figures, costs, survey outcomes, performance indicators—one feature can shake things up: Pivot Tables in excel.
They’re like a built-in secret weapon to make sense of the mess. Want to break down income by product or area? Compare quarterly results without a bunch of formulas? Check how team performance changed month to month? A Pivot Table in excel does that in a flash. And don’t worry, you don’t need to be an Excel expert to use them. They’re pretty simple to start with., after you make your first one, you’ll ask yourself why no one showed you earlier.
In today’s workplace, knowing how to organize and understand data isn’t just for data analysts. It’s helpful in all areas—from marketing to HR to operations. If you can turn jumbled figures into clear insights, you’re a step ahead.
So, if you’ve never used a Pivot Table now’s your chance. It’s one of those little skills that pays off—quicker reports smarter choices, and way less spreadsheet headache.
What Is a Pivot Table?
A Pivot Table serves as a key feature in Microsoft Excel enabling users to sum up and examine big data sets in no time. It helps you gain useful insights by reshuffling your data—without altering the source material.
Take monthly sales data across several branches as an example. A Pivot Table lets you:
- Display total sales for each branch
- Match sales across product groups
- Study performance through time
- Spot patterns or odd results
You can do all this in a short time—often without typing a single formula.
The Value of Pivot Table In Excel for Working Professionals
If you work with spreadsheets, no matter your job, Pivot Tables can make your tasks much simpler. Here’s why they should be part of your work skills:
- They Save Time
Filtering, sorting, and calculating data by hand can eat up hours. Pivot Tables do all that with just a few mouse clicks. You can sum up hundreds or thousands of rows in no time.
- They Make You Look Organized and Efficient
When you share performance reports with bosses or show customer feedback insights, Pivot Tables help you create neat summaries that people can read and understand.
- No Need for Advanced Excel Skills
Unlike tricky formulas and macros, Pivot Tables have a simple drag-and-drop setup. You pick what you want to analyze, and Excel takes care of the rest.
- They’re Used Across Every Industry
Pivot Table in excel have an impact on various fields, including finance, logistics, HR, sales, education, and healthcare. They benefit anyone who works with data, whether it’s attendance records, budgets, client reports, or inventory.
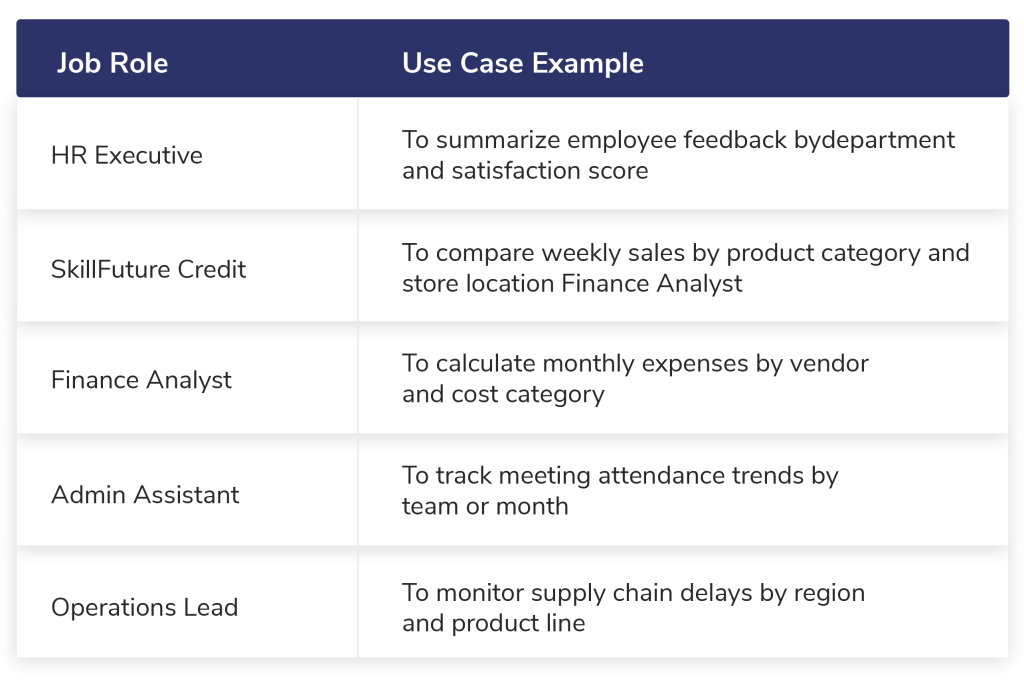
Real-World Examples
Here’s how professionals use Pivot Table in Excel for their work:
How to Create a Pivot Table in Excel (Step-by-Step)
Let’s say you’re working with a table like this:
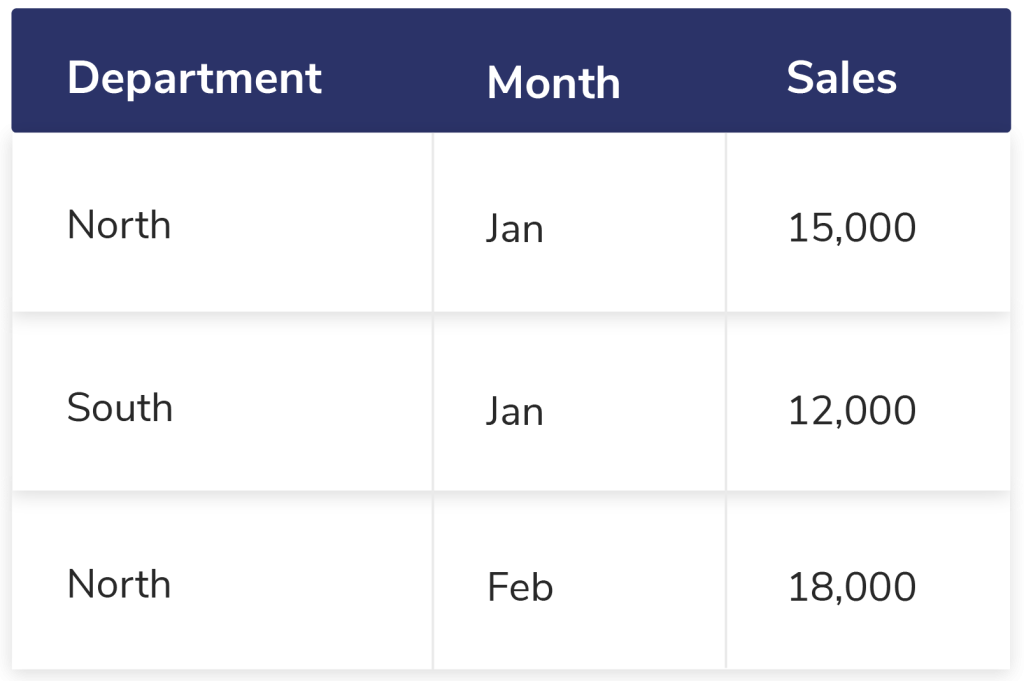
You need to find out the sales figures for each department on a monthly basis. Here’s a step-by-step guide to achieve this:
1. Get Your Data Ready
Make sure your data includes headers and doesn’t have any empty rows or columns.
2. Create a Pivot Table
- Highlight all your data.
- Go to Insert > PivotTable.
- Select a new worksheet to place your Pivot Table.
3. Arrange the Pivot Table Fields
- Move Department into the Rows section.
- Put Month in the Columns section.
- Drop Sales into the Values section.
That’s all! Your Pivot Table will display total sales for each department across every month.
Key Pivot Table in Excel Functions You Need to Know
Pivot Tables have more capabilities than just totals. Here are some useful features:
- Sum up by Count, Average, or Percentage – Not limited to totals
- Group Data by Date – Merge days into months or quarters
- Use Filters or Slicers – Zero in on specific teams, products, or time frames
- Generate Pivot Charts – See the data straight from your Pivot Table
Common Errors to Steer Clear Of
Although Pivot Tables are straightforward, a few mistakes can make them annoying.
Here’s what to look out for:
- Headers That Don’t Match
Check that each column in your dataset has a clear unique label at the top.
- Empty Rows or Columns
These can stop Excel from seeing all your data.
- Forgetting to Update the Table
When your original data changes right-click on the Pivot Table and select Refresh.
- Cramming in Too Many Fields
Keep things basic. Putting in too much at once can make the table tough to understand.
Smart Ways to Use Pivot Tables
Here are some more tricks to get the most out of Pivot Tables:
- Give User-Friendly Field Header Names for easy-to-read reports.
- Apply Conditional Formatting to make important values pop.
- Paste Pivot Table as Values when you need to share data without formulas.
- Try Out Pivot Charts to create bar or line graphs.
Are Pivot Tables In Excel Useful Outside of Data and Finance Jobs?
You bet.
Data shows up everywhere in today’s work, not just in spreadsheets. Even if your job isn’t data-heavy, Pivot Tables help you:
- Keep an eye on KPI progress
- Look at feedback from events or training
- Make reports without human errors
- Cut down time spent summarizing regular data sets
No matter your job – office manager small business owner, teacher, or company boss – understanding data can boost your work and make you feel more sure of yourself. To
Wrap Up
You don’t need to study data science to get something out of Pivot Tables. You just need to know the basics of how they work and try them out on a few real examples. This one Excel feature can save you lots of time, make your reports better, and help you find insights that lead to smarter choices. If you’ve never tried Pivot Tables open Excel and check them out. They might end up being the most useful tool in your daily work.

I’ve always been drawn to the power of writing! As a content writer, I love the challenge of finding the right words to capture the essence of HR, payroll, and accounting software. I enjoy breaking down complex concepts, making technical information easy to understand, and helping businesses see the real impact of the right tools.