Why Pivot Table in Excel?
Opening an Excel sheet crammed with hundreds or thousands of rows of information can seem overwhelming. Whether you’re dealing with sales data, attendance sheets, budgets, survey results, or performance summaries, it can quickly feel like a flood of confusing numbers. This is where learning Pivot Tables in Excel proves to be one of the most critical skills for any professional to master.
By 2026, understanding data is not just a skill reserved for analysts or finance departments anymore. In Singapore, employers want employees in HR, operations, administration, marketing, and management to grasp data well. They need to summarize, explain, and use it to make decisions. Pivot Tables offer an easy yet effective way to achieve this without requiring complex formulas or advanced technical knowledge.
What Is a Pivot Table in Excel?
A Pivot Table is an Excel feature that helps you group, sort, and review large amounts of data. Instead of wasting time doing calculations manually or making tricky formulas, you can use a Pivot Table to sort data and find answers. For example, you might use it to find things like,
- Display total sales for each branch
- Match sales across product groups
- Study performance through time
- Spot patterns or odd results
Pivot Tables are super useful because they keep your original information untouched. You can spot trends, compare sections, or pull out useful facts just by arranging fields . This makes them perfect for anyone who needs fast results without hours of editing and fixing spreadsheets.
What is the Importance of Pivot Tables in Modern Workplaces?
In today’s workplaces, speed and accuracy are key. Managers need quick insights, teams aim for clear reports, and more decisions now rely on data. Pivot Tables act as a tool to turn raw numbers into useful information.
- They Save Time
Filtering, sorting, and calculating data manually can eat up hours. Pivot Tables do all that with just a few mouse clicks. You can sum up hundreds or thousands of rows in no time.
- They Make You Look Organized and Efficient
When you share performance reports with employers or show customer feedback insights, Pivot Tables help you create neat summaries that people can read and understand.
- No Need for Advanced Excel Skills
Unlike tricky formulas and macros, Pivot Tables have a simple drag-and-drop setup. You pick what you want to analyze, and Excel takes care of the rest.
- They’re Used Across Every Industry
Pivot Table in excel have an impact on various fields, including finance, logistics, HR, sales, education, and healthcare. They benefit anyone who works with data, whether it’s attendance records, budgets, client reports, or inventory.
Even more important, Pivot Tables show that you’re organised and confident with data. When you share clear summaries instead of cluttered spreadsheets, people understand your work better and are more likely to trust your analysis.
How Different Roles Utilize Pivot Tables?
Pivot Tables go beyond just finance or accounting. Professionals across industries and jobs in Singapore use them every day.
| Role | How Pivot Tables Are Used |
| HR & Admin | Summarising attendance, leave trends, payroll data |
| Sales & Marketing | Analysing monthly sales, campaign performance |
| Operations | Tracking inventory movement, supplier data |
| Education & Training | Reviewing assessment results, feedback trends |
| SME Owners | Monitoring cash flow, expenses, and growth patterns |
Because they can do so much in different areas, Pivot Tables are seen as an essential workplace skill instead of a specialized one.
Why Pivot Tables Make Work Easier and Less Stressful?
Reviewing data or creating reports step by step takes a lot of time and can be exhausting. Pivot Tables help by letting you work with data in a more interactive way. They make it easy to switch views sort information by dates, categories, or regions, and create summaries without redoing everything from scratch.
To handle several tasks at once, being able to find answers fast can ease the daily workload and boost how much you get done.
How to Make a Pivot Table in Excel?
Let’s say you’re working with a table like this:
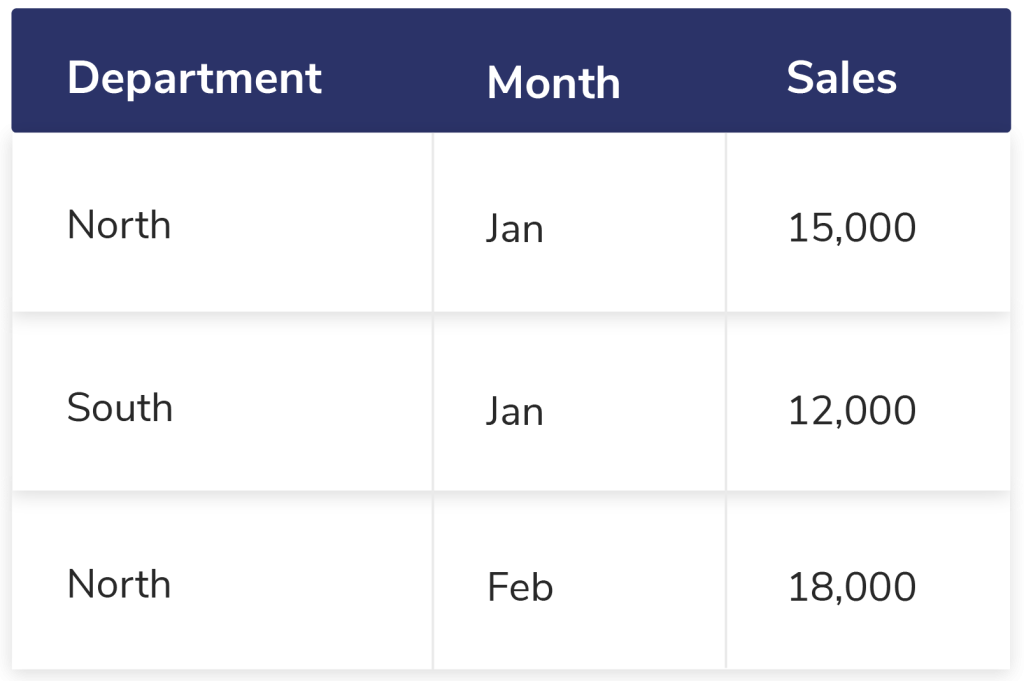
You need to find out the sales figures for each department on a monthly basis. Here’s a step-by-step guide to achieve this:
1. Get Your Data Ready
Make sure your data includes headers and doesn’t have any empty rows or columns.
2. Create a Pivot Table
- Highlight all your data.
- Go to Insert > PivotTable.
- Select a new worksheet to place your Pivot Table.
3. Arrange the Pivot Table Fields
- Move Department into the Rows section.
- Put Month in the Columns section.
- Drop Sales into the Values section.
That’s all! Your Pivot Table will display total sales for each department across every month.
What Are the Features of Pivot Tables?
Pivot Tables go far beyond just showing totals. They include strong tools that help improve analysis. Users can switch calculations between sums, averages, or counts, organize dates into months or quarters, narrow down results by filtering for specific teams or products, and even make Pivot Charts to present data intelligently.
- Sum up by Count, Average, or Percentage – Not limited to totals
- Group Data by Date – Merge days into months or quarters
- Use Filters or Slicers – Zero in on specific teams, products, or time frames
- Generate Pivot Charts – See the data straight from your Pivot Table
These capabilities help experts interact with their data in a smarter way instead of simply creating basic static reports.
What Are the Common Pivot Table Errors?
Although Pivot Tables are easy to use, a few errors might reduce their usefulness. Data may not display if column headers are inconsistent or there are blank rows. If you forget to update the Pivot Table after editing original data, you might see old and incorrect results. Adding too many fields to a Pivot Table can make it more messy and harder to understand than helpful.
Knowing these basics makes sure Pivot Tables stay helpful and save time instead of causing confusion.
Do Pivot Tables Work For Non-Data Jobs?
Yes, they do. By 2026 every job uses data in some way. Whether it’s checking progress keeping an eye on expenses, or going over feedback, data plays a part. Pivot Tables let professionals in all kinds of careers spot patterns, check growth, and create reports without needing extra help.
Even if someone isn’t confident with numbers, Pivot Tables offer a clear and organized way to understand data.
How Pivot Tables Can Boost Your Job Opportunities?
Companies now appreciate employees who handle data with confidence. Knowing Pivot Tables proves you are not just typing numbers but grasping their significance. This ability boosts your chances of getting hired, helps in making smarter decisions, and makes it easier to explain insights to employers or customers.
To start a career or for recent grads, Pivot Tables can be helpful since they connect what you learn in class with what jobs need.
Why is it Important for Professionals to Know Pivot Tables in Excel?
Professionals should know how to use Pivot Tables because they help summarize and examine large chunks of data without needing tricky formulas. These tables save time, cut down on mistakes, and make raw information easy to understand. By 2026, people see them as a must-have skill for digital workplaces, no matter if you’re in HR, sales, management, or operations. They stay important for jobs in digital offices and WSQ courses.
Pivot Table in Excel FAQs
Are Pivot Tables tough to understand for beginners?
Pivot Tables are easy to pick up even if you’re new to Excel. Most learners can grasp the basics pretty fast. With clear instructions and hands-on practice, students and people without technical backgrounds can use Pivot Tables for regular reporting.
Do you need formulas to use Pivot Tables?
No, you don’t need formulas. Pivot Tables rely on drag-and-drop actions. Excel takes care of things like totals, averages, and counts . You can use formulas to dig deeper into data, but they are not necessary to create or use Pivot Tables.
Are Pivot Tables still useful in 2026?
Yes, they are. Even with new tools and more automation, Pivot Tables are still everywhere in offices. They are quick, easy to use, and already built into Excel. They stay important for jobs in digital offices and WSQ-courses.
What kinds of jobs benefit the most from Pivot Tables?
Pivot Tables help professionals working in HR, admin, finance, operations, sales, marketing, teaching, and managing small businesses. Anyone who needs to manage, summarize, or report data can find them useful.

I’ve always been drawn to the power of writing! As a content writer, I love the challenge of finding the right words to capture the essence of HR, payroll, and accounting software. I enjoy breaking down complex concepts, making technical information easy to understand, and helping businesses see the real impact of the right tools.